|
Download Data (XLS File) |
|
|||||
|
|||||
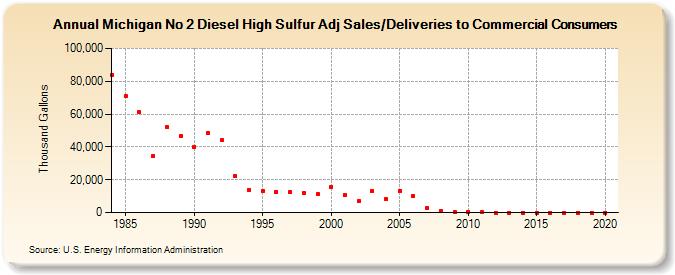
| Michigan No 2 Diesel High Sulfur Adj Sales/Deliveries to Commercial Consumers (Thousand Gallons) | |||||
| Decade | Year-0 | Year-1 | Year-2 | Year-3 | Year-4 | Year-5 | Year-6 | Year-7 | Year-8 | Year-9 |
|---|---|---|---|---|---|---|---|---|---|---|
| 1980's | 83,952 | 70,817 | 61,086 | 34,154 | 52,196 | 46,387 | ||||
| 1990's | 40,201 | 48,243 | 43,981 | 22,164 | 14,017 | 13,199 | 12,776 | 12,410 | 11,998 | 11,191 |
| 2000's | 15,507 | 10,918 | 7,032 | 13,187 | 8,006 | 13,434 | 10,112 | 2,792 | 1,047 | 358 |
| 2010's | 443 | 266 | 0 | 0 | 0 | 0 | 0 | 0 | 0 | 0 |
| 2020's | 0 |
| - = No Data Reported; -- = Not Applicable; NA = Not Available; W = Withheld to avoid disclosure of individual company data. |
| Release Date: 2/9/2022 |
| Next Release Date: Suspended |