|
Download Data (XLS File) |
|
|||||
|
|||||
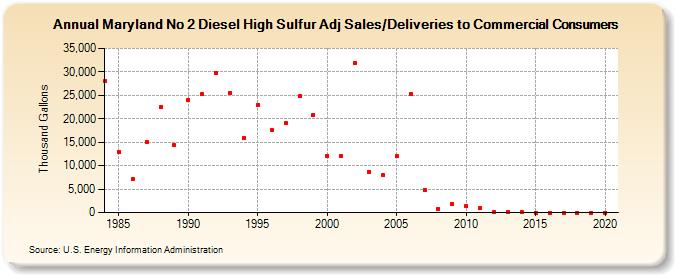
| Maryland No 2 Diesel High Sulfur Adj Sales/Deliveries to Commercial Consumers (Thousand Gallons) | |||||
| Decade | Year-0 | Year-1 | Year-2 | Year-3 | Year-4 | Year-5 | Year-6 | Year-7 | Year-8 | Year-9 |
|---|---|---|---|---|---|---|---|---|---|---|
| 1980's | 28,066 | 12,986 | 7,075 | 15,096 | 22,408 | 14,327 | ||||
| 1990's | 24,055 | 25,177 | 29,831 | 25,564 | 15,861 | 23,031 | 17,637 | 19,039 | 24,766 | 20,879 |
| 2000's | 12,017 | 12,116 | 31,906 | 8,740 | 7,970 | 11,979 | 25,343 | 4,853 | 792 | 1,819 |
| 2010's | 1,294 | 940 | 203 | 216 | 224 | 0 | 0 | 0 | 0 | 0 |
| 2020's | 0 |
| - = No Data Reported; -- = Not Applicable; NA = Not Available; W = Withheld to avoid disclosure of individual company data. |
| Release Date: 2/9/2022 |
| Next Release Date: Suspended |