|
Download Data (XLS File) |
|
|||||
|
|||||
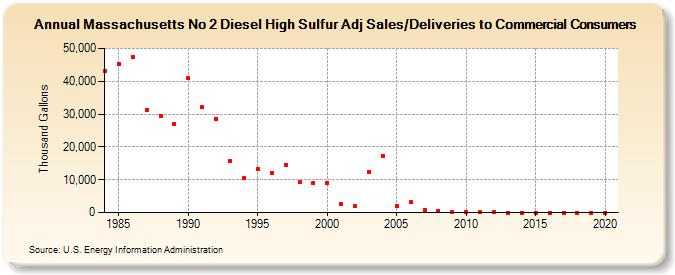
| Massachusetts No 2 Diesel High Sulfur Adj Sales/Deliveries to Commercial Consumers (Thousand Gallons) | |||||
| Decade | Year-0 | Year-1 | Year-2 | Year-3 | Year-4 | Year-5 | Year-6 | Year-7 | Year-8 | Year-9 |
|---|---|---|---|---|---|---|---|---|---|---|
| 1980's | 43,118 | 45,193 | 47,432 | 31,285 | 29,541 | 27,087 | ||||
| 1990's | 40,913 | 32,039 | 28,608 | 15,781 | 10,436 | 13,406 | 12,161 | 14,615 | 9,200 | 8,933 |
| 2000's | 9,119 | 2,685 | 1,852 | 12,488 | 17,228 | 2,091 | 3,066 | 789 | 577 | 94 |
| 2010's | 118 | 26 | 57 | 7 | 7 | 9 | 0 | 0 | 0 | 0 |
| 2020's | 0 |
| - = No Data Reported; -- = Not Applicable; NA = Not Available; W = Withheld to avoid disclosure of individual company data. |
| Release Date: 2/9/2022 |
| Next Release Date: Suspended |