|
Download Data (XLS File) |
|
|||||
|
|||||
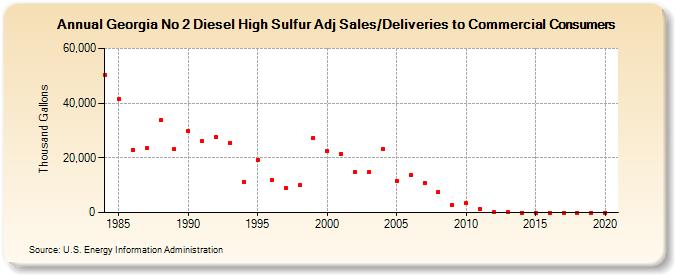
| Georgia No 2 Diesel High Sulfur Adj Sales/Deliveries to Commercial Consumers (Thousand Gallons) | |||||
| Decade | Year-0 | Year-1 | Year-2 | Year-3 | Year-4 | Year-5 | Year-6 | Year-7 | Year-8 | Year-9 |
|---|---|---|---|---|---|---|---|---|---|---|
| 1980's | 50,395 | 41,565 | 22,869 | 23,452 | 33,651 | 23,137 | ||||
| 1990's | 29,821 | 25,994 | 27,605 | 25,545 | 11,300 | 19,364 | 12,044 | 8,983 | 9,968 | 27,309 |
| 2000's | 22,528 | 21,543 | 15,002 | 14,672 | 23,087 | 11,685 | 13,806 | 10,834 | 7,696 | 2,797 |
| 2010's | 3,335 | 1,318 | 273 | 119 | 0 | 0 | 0 | 0 | 0 | 0 |
| 2020's | 0 |
| - = No Data Reported; -- = Not Applicable; NA = Not Available; W = Withheld to avoid disclosure of individual company data. |
| Release Date: 2/9/2022 |
| Next Release Date: Suspended |