|
Download Data (XLS File) |
|
|||||
|
|||||
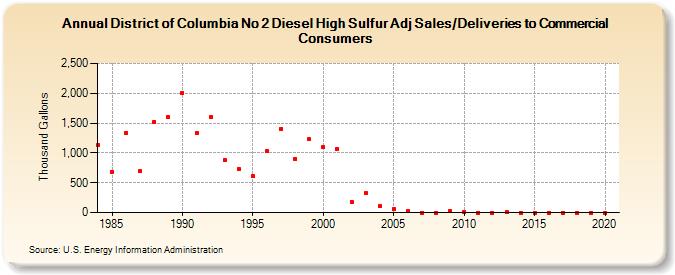
| District of Columbia No 2 Diesel High Sulfur Adj Sales/Deliveries to Commercial Consumers (Thousand Gallons) | |||||
| Decade | Year-0 | Year-1 | Year-2 | Year-3 | Year-4 | Year-5 | Year-6 | Year-7 | Year-8 | Year-9 |
|---|---|---|---|---|---|---|---|---|---|---|
| 1980's | 1,130 | 688 | 1,336 | 689 | 1,524 | 1,598 | ||||
| 1990's | 2,007 | 1,330 | 1,597 | 885 | 733 | 606 | 1,026 | 1,408 | 905 | 1,227 |
| 2000's | 1,103 | 1,059 | 182 | 326 | 105 | 63 | 19 | 1 | 0 | 30 |
| 2010's | 14 | 0 | 0 | 8 | 0 | 0 | 0 | 0 | 0 | 0 |
| 2020's | 0 |
| - = No Data Reported; -- = Not Applicable; NA = Not Available; W = Withheld to avoid disclosure of individual company data. |
| Release Date: 2/9/2022 |
| Next Release Date: Suspended |