|
Download Data (XLS File) |
|
|||||
|
|||||
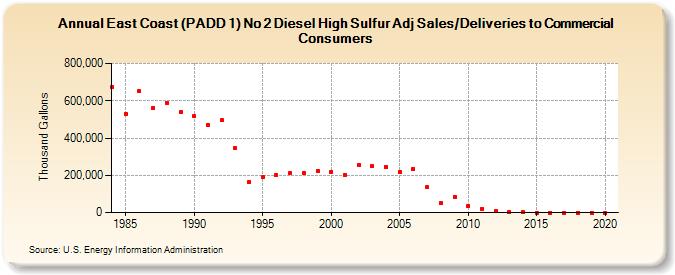
| East Coast (PADD 1) No 2 Diesel High Sulfur Adj Sales/Deliveries to Commercial Consumers (Thousand Gallons) | |||||
| Decade | Year-0 | Year-1 | Year-2 | Year-3 | Year-4 | Year-5 | Year-6 | Year-7 | Year-8 | Year-9 |
|---|---|---|---|---|---|---|---|---|---|---|
| 1980's | 672,209 | 531,195 | 651,134 | 561,394 | 590,054 | 538,227 | ||||
| 1990's | 516,063 | 471,605 | 494,238 | 344,363 | 163,385 | 189,189 | 200,216 | 211,941 | 214,496 | 224,382 |
| 2000's | 216,404 | 203,235 | 253,331 | 247,551 | 246,893 | 216,809 | 233,980 | 135,582 | 49,119 | 85,773 |
| 2010's | 34,443 | 21,003 | 6,335 | 2,130 | 590 | 9 | 0 | 0 | 0 | 0 |
| 2020's | 0 |
| - = No Data Reported; -- = Not Applicable; NA = Not Available; W = Withheld to avoid disclosure of individual company data. |
| Release Date: 2/9/2022 |
| Next Release Date: Suspended |