|
Download Data (XLS File) |
|
|||||
|
|||||
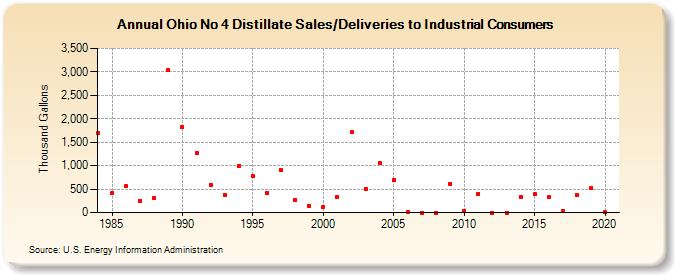
| Ohio No 4 Distillate Sales/Deliveries to Industrial Consumers (Thousand Gallons) | |||||
| Decade | Year-0 | Year-1 | Year-2 | Year-3 | Year-4 | Year-5 | Year-6 | Year-7 | Year-8 | Year-9 |
|---|---|---|---|---|---|---|---|---|---|---|
| 1980's | 1,688 | 417 | 563 | 255 | 310 | 3,033 | ||||
| 1990's | 1,819 | 1,261 | 590 | 371 | 1,002 | 778 | 426 | 910 | 277 | 142 |
| 2000's | 109 | 323 | 1,711 | 508 | 1,067 | 695 | 7 | 0 | 0 | 618 |
| 2010's | 43 | 402 | 0 | 0 | 328 | 386 | 330 | 24 | 382 | 527 |
| 2020's | 4 |
| - = No Data Reported; -- = Not Applicable; NA = Not Available; W = Withheld to avoid disclosure of individual company data. |
| Release Date: 2/9/2022 |
| Next Release Date: Suspended |