|
Download Data (XLS File) |
|
|||||
|
|||||
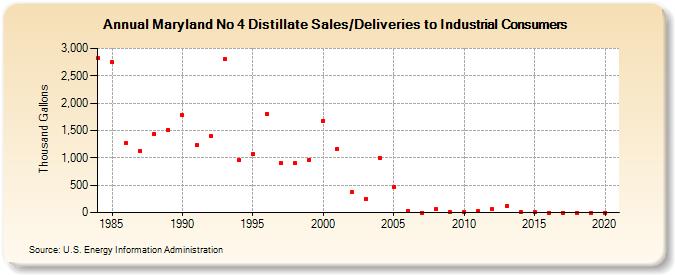
| Maryland No 4 Distillate Sales/Deliveries to Industrial Consumers (Thousand Gallons) | |||||
| Decade | Year-0 | Year-1 | Year-2 | Year-3 | Year-4 | Year-5 | Year-6 | Year-7 | Year-8 | Year-9 |
|---|---|---|---|---|---|---|---|---|---|---|
| 1980's | 2,818 | 2,746 | 1,270 | 1,121 | 1,439 | 1,512 | ||||
| 1990's | 1,781 | 1,239 | 1,400 | 2,803 | 952 | 1,071 | 1,810 | 904 | 898 | 966 |
| 2000's | 1,681 | 1,165 | 369 | 255 | 1,005 | 468 | 33 | 0 | 64 | 6 |
| 2010's | 18 | 24 | 66 | 117 | 14 | 6 | 0 | 0 | 0 | 0 |
| 2020's | 0 |
| - = No Data Reported; -- = Not Applicable; NA = Not Available; W = Withheld to avoid disclosure of individual company data. |
| Release Date: 2/9/2022 |
| Next Release Date: Suspended |