|
Download Data (XLS File) |
|
|||||
|
|||||
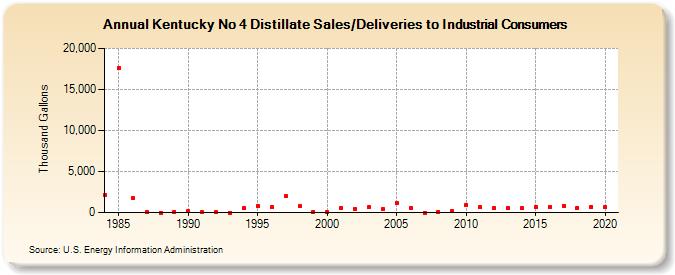
| Kentucky No 4 Distillate Sales/Deliveries to Industrial Consumers (Thousand Gallons) | |||||
| Decade | Year-0 | Year-1 | Year-2 | Year-3 | Year-4 | Year-5 | Year-6 | Year-7 | Year-8 | Year-9 |
|---|---|---|---|---|---|---|---|---|---|---|
| 1980's | 2,116 | 17,584 | 1,727 | 75 | 5 | 123 | ||||
| 1990's | 141 | 83 | 16 | 0 | 500 | 809 | 666 | 1,963 | 751 | 123 |
| 2000's | 64 | 613 | 438 | 646 | 429 | 1,116 | 595 | 0 | 100 | 132 |
| 2010's | 900 | 626 | 567 | 548 | 545 | 666 | 736 | 835 | 596 | 699 |
| 2020's | 628 |
| - = No Data Reported; -- = Not Applicable; NA = Not Available; W = Withheld to avoid disclosure of individual company data. |
| Release Date: 2/9/2022 |
| Next Release Date: Suspended |