|
Download Data (XLS File) |
|
|||||
|
|||||
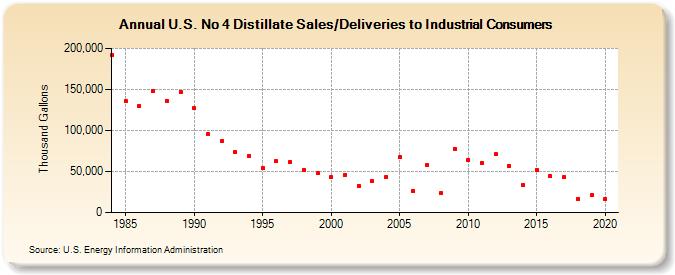
| U.S. No 4 Distillate Sales/Deliveries to Industrial Consumers (Thousand Gallons) | |||||
| Decade | Year-0 | Year-1 | Year-2 | Year-3 | Year-4 | Year-5 | Year-6 | Year-7 | Year-8 | Year-9 |
|---|---|---|---|---|---|---|---|---|---|---|
| 1980's | 191,525 | 135,535 | 130,084 | 148,486 | 136,429 | 147,277 | ||||
| 1990's | 126,963 | 95,528 | 86,878 | 73,430 | 69,054 | 54,327 | 62,423 | 61,729 | 52,259 | 48,092 |
| 2000's | 42,974 | 45,968 | 32,409 | 37,998 | 43,066 | 67,118 | 26,006 | 57,749 | 23,525 | 77,864 |
| 2010's | 64,363 | 60,534 | 71,105 | 56,456 | 33,779 | 52,176 | 44,013 | 43,096 | 17,027 | 20,902 |
| 2020's | 16,562 |
| - = No Data Reported; -- = Not Applicable; NA = Not Available; W = Withheld to avoid disclosure of individual company data. |
| Release Date: 2/9/2022 |
| Next Release Date: Suspended |