|
Download Data (XLS File) |
|
|||||
|
|||||
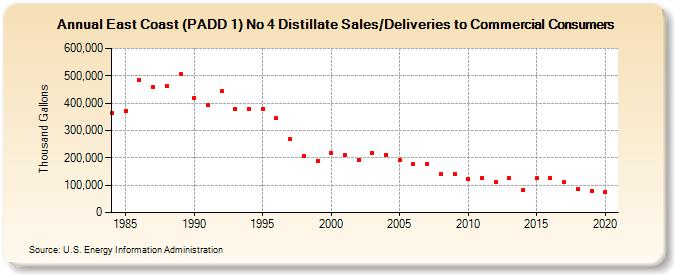
| East Coast (PADD 1) No 4 Distillate Sales/Deliveries to Commercial Consumers (Thousand Gallons) | |||||
| Decade | Year-0 | Year-1 | Year-2 | Year-3 | Year-4 | Year-5 | Year-6 | Year-7 | Year-8 | Year-9 |
|---|---|---|---|---|---|---|---|---|---|---|
| 1980's | 362,372 | 369,660 | 483,784 | 460,569 | 462,641 | 505,475 | ||||
| 1990's | 420,378 | 393,626 | 444,326 | 379,043 | 378,168 | 379,618 | 344,436 | 270,527 | 206,255 | 190,032 |
| 2000's | 216,228 | 210,431 | 191,285 | 218,731 | 211,447 | 191,008 | 176,414 | 179,005 | 140,037 | 141,003 |
| 2010's | 122,353 | 126,626 | 111,978 | 124,910 | 82,298 | 124,868 | 126,923 | 110,029 | 84,797 | 80,436 |
| 2020's | 74,299 |
| - = No Data Reported; -- = Not Applicable; NA = Not Available; W = Withheld to avoid disclosure of individual company data. |
| Release Date: 2/9/2022 |
| Next Release Date: Suspended |