|
Download Data (XLS File) |
|
|||||
|
|||||
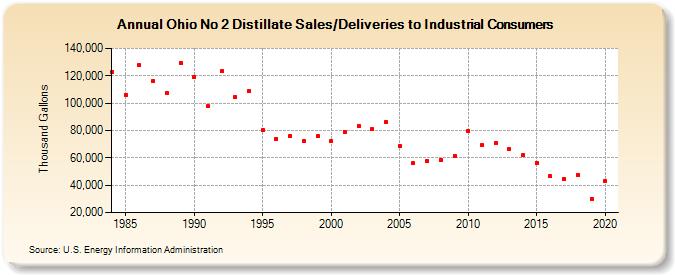
| Ohio No 2 Distillate Sales/Deliveries to Industrial Consumers (Thousand Gallons) | |||||
| Decade | Year-0 | Year-1 | Year-2 | Year-3 | Year-4 | Year-5 | Year-6 | Year-7 | Year-8 | Year-9 |
|---|---|---|---|---|---|---|---|---|---|---|
| 1980's | 122,647 | 106,041 | 127,735 | 116,153 | 107,044 | 129,582 | ||||
| 1990's | 119,279 | 97,630 | 123,412 | 104,413 | 108,563 | 80,344 | 74,003 | 75,805 | 72,178 | 75,613 |
| 2000's | 72,269 | 79,224 | 83,409 | 80,921 | 86,514 | 68,684 | 55,938 | 57,390 | 58,598 | 61,659 |
| 2010's | 79,571 | 69,371 | 70,576 | 66,404 | 62,006 | 56,454 | 46,415 | 44,683 | 47,745 | 30,073 |
| 2020's | 42,778 |
| - = No Data Reported; -- = Not Applicable; NA = Not Available; W = Withheld to avoid disclosure of individual company data. |
| Release Date: 2/9/2022 |
| Next Release Date: Suspended |