|
Download Data (XLS File) |
|
|||||
|
|||||
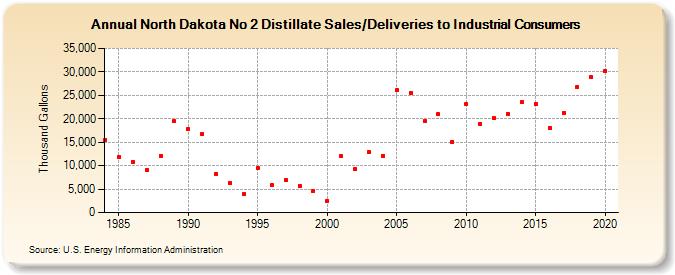
| North Dakota No 2 Distillate Sales/Deliveries to Industrial Consumers (Thousand Gallons) | |||||
| Decade | Year-0 | Year-1 | Year-2 | Year-3 | Year-4 | Year-5 | Year-6 | Year-7 | Year-8 | Year-9 |
|---|---|---|---|---|---|---|---|---|---|---|
| 1980's | 15,559 | 11,814 | 10,883 | 9,088 | 12,101 | 19,546 | ||||
| 1990's | 17,765 | 16,815 | 8,294 | 6,385 | 3,923 | 9,514 | 5,805 | 6,919 | 5,654 | 4,562 |
| 2000's | 2,473 | 11,967 | 9,268 | 12,913 | 12,126 | 26,045 | 25,467 | 19,546 | 20,916 | 15,149 |
| 2010's | 23,113 | 18,969 | 20,155 | 21,109 | 23,563 | 23,063 | 18,107 | 21,303 | 26,814 | 28,838 |
| 2020's | 30,227 |
| - = No Data Reported; -- = Not Applicable; NA = Not Available; W = Withheld to avoid disclosure of individual company data. |
| Release Date: 2/9/2022 |
| Next Release Date: Suspended |