|
Download Data (XLS File) |
|
|||||
|
|||||
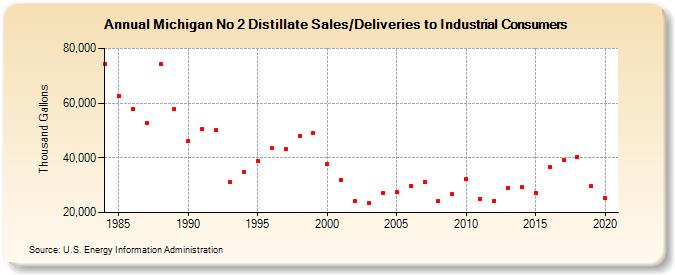
| Michigan No 2 Distillate Sales/Deliveries to Industrial Consumers (Thousand Gallons) | |||||
| Decade | Year-0 | Year-1 | Year-2 | Year-3 | Year-4 | Year-5 | Year-6 | Year-7 | Year-8 | Year-9 |
|---|---|---|---|---|---|---|---|---|---|---|
| 1980's | 74,396 | 62,600 | 58,011 | 52,644 | 74,190 | 57,690 | ||||
| 1990's | 46,225 | 50,461 | 50,136 | 31,104 | 34,754 | 38,769 | 43,621 | 43,099 | 48,148 | 48,979 |
| 2000's | 37,583 | 31,819 | 24,328 | 23,378 | 27,142 | 27,683 | 29,888 | 31,103 | 24,279 | 26,619 |
| 2010's | 32,213 | 25,082 | 24,317 | 28,806 | 29,216 | 27,321 | 36,702 | 39,177 | 40,227 | 29,560 |
| 2020's | 25,212 |
| - = No Data Reported; -- = Not Applicable; NA = Not Available; W = Withheld to avoid disclosure of individual company data. |
| Release Date: 2/9/2022 |
| Next Release Date: Suspended |