|
Download Data (XLS File) |
|
|||||
|
|||||
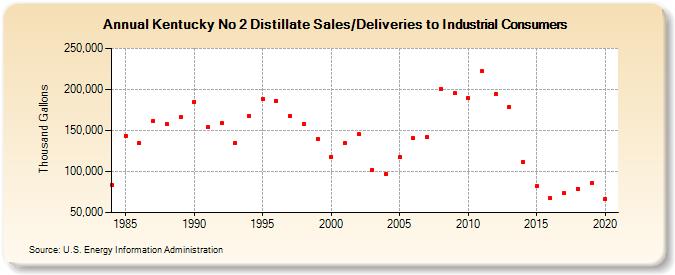
| Kentucky No 2 Distillate Sales/Deliveries to Industrial Consumers (Thousand Gallons) | |||||
| Decade | Year-0 | Year-1 | Year-2 | Year-3 | Year-4 | Year-5 | Year-6 | Year-7 | Year-8 | Year-9 |
|---|---|---|---|---|---|---|---|---|---|---|
| 1980's | 83,365 | 143,658 | 134,477 | 161,974 | 157,280 | 165,900 | ||||
| 1990's | 185,104 | 153,679 | 158,803 | 135,079 | 167,744 | 188,439 | 186,252 | 167,681 | 158,246 | 139,969 |
| 2000's | 118,002 | 134,723 | 145,700 | 102,282 | 96,389 | 117,668 | 140,505 | 141,726 | 200,874 | 195,206 |
| 2010's | 189,722 | 221,920 | 194,480 | 179,008 | 111,759 | 82,075 | 67,521 | 73,970 | 79,063 | 85,496 |
| 2020's | 67,066 |
| - = No Data Reported; -- = Not Applicable; NA = Not Available; W = Withheld to avoid disclosure of individual company data. |
| Release Date: 2/9/2022 |
| Next Release Date: Suspended |