|
Download Data (XLS File) |
|
|||||
|
|||||
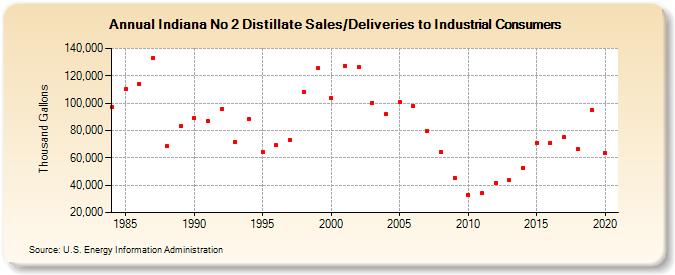
| Indiana No 2 Distillate Sales/Deliveries to Industrial Consumers (Thousand Gallons) | |||||
| Decade | Year-0 | Year-1 | Year-2 | Year-3 | Year-4 | Year-5 | Year-6 | Year-7 | Year-8 | Year-9 |
|---|---|---|---|---|---|---|---|---|---|---|
| 1980's | 96,899 | 110,218 | 114,107 | 133,181 | 68,388 | 83,049 | ||||
| 1990's | 89,292 | 86,985 | 95,871 | 71,813 | 88,326 | 64,576 | 69,100 | 73,309 | 108,053 | 125,450 |
| 2000's | 103,898 | 127,475 | 126,150 | 100,361 | 92,000 | 100,559 | 97,752 | 79,906 | 64,432 | 45,455 |
| 2010's | 33,181 | 33,937 | 41,296 | 43,489 | 52,626 | 71,054 | 71,040 | 74,961 | 66,169 | 95,309 |
| 2020's | 63,370 |
| - = No Data Reported; -- = Not Applicable; NA = Not Available; W = Withheld to avoid disclosure of individual company data. |
| Release Date: 2/9/2022 |
| Next Release Date: Suspended |