|
Download Data (XLS File) |
|
|||||
|
|||||
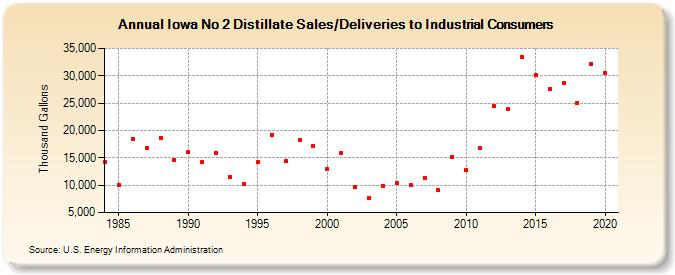
| Iowa No 2 Distillate Sales/Deliveries to Industrial Consumers (Thousand Gallons) | |||||
| Decade | Year-0 | Year-1 | Year-2 | Year-3 | Year-4 | Year-5 | Year-6 | Year-7 | Year-8 | Year-9 |
|---|---|---|---|---|---|---|---|---|---|---|
| 1980's | 14,277 | 10,055 | 18,500 | 16,770 | 18,638 | 14,638 | ||||
| 1990's | 16,014 | 14,222 | 15,923 | 11,584 | 10,136 | 14,309 | 19,216 | 14,471 | 18,315 | 17,130 |
| 2000's | 12,891 | 15,884 | 9,716 | 7,734 | 9,927 | 10,368 | 10,015 | 11,318 | 9,101 | 15,206 |
| 2010's | 12,831 | 16,743 | 24,403 | 23,935 | 33,495 | 30,047 | 27,495 | 28,741 | 24,996 | 32,115 |
| 2020's | 30,458 |
| - = No Data Reported; -- = Not Applicable; NA = Not Available; W = Withheld to avoid disclosure of individual company data. |
| Release Date: 2/9/2022 |
| Next Release Date: Suspended |