|
Download Data (XLS File) |
|
|||||
|
|||||
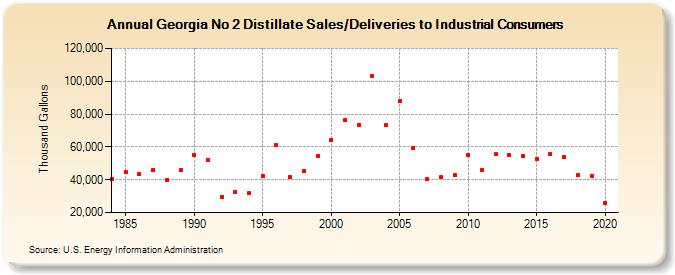
| Georgia No 2 Distillate Sales/Deliveries to Industrial Consumers (Thousand Gallons) | |||||
| Decade | Year-0 | Year-1 | Year-2 | Year-3 | Year-4 | Year-5 | Year-6 | Year-7 | Year-8 | Year-9 |
|---|---|---|---|---|---|---|---|---|---|---|
| 1980's | 40,360 | 44,563 | 43,262 | 45,772 | 39,850 | 46,130 | ||||
| 1990's | 55,075 | 51,921 | 29,586 | 32,560 | 31,690 | 42,456 | 61,268 | 41,656 | 45,080 | 54,291 |
| 2000's | 64,399 | 76,330 | 73,638 | 102,886 | 73,123 | 87,847 | 59,340 | 40,156 | 41,615 | 42,874 |
| 2010's | 55,121 | 45,821 | 55,531 | 54,879 | 54,732 | 52,784 | 55,580 | 53,716 | 42,719 | 42,108 |
| 2020's | 25,578 |
| - = No Data Reported; -- = Not Applicable; NA = Not Available; W = Withheld to avoid disclosure of individual company data. |
| Release Date: 2/9/2022 |
| Next Release Date: Suspended |