|
Download Data (XLS File) |
|
|||||
|
|||||
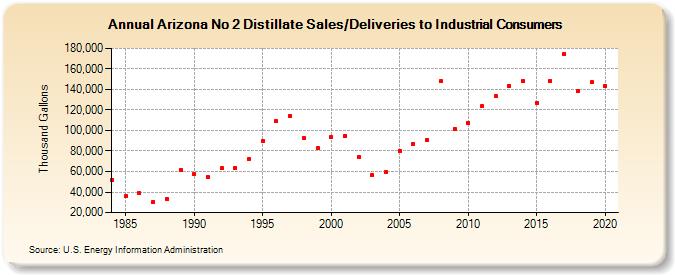
| Arizona No 2 Distillate Sales/Deliveries to Industrial Consumers (Thousand Gallons) | |||||
| Decade | Year-0 | Year-1 | Year-2 | Year-3 | Year-4 | Year-5 | Year-6 | Year-7 | Year-8 | Year-9 |
|---|---|---|---|---|---|---|---|---|---|---|
| 1980's | 51,624 | 36,037 | 39,235 | 30,172 | 33,092 | 61,482 | ||||
| 1990's | 57,103 | 54,471 | 62,997 | 63,557 | 72,313 | 89,396 | 108,859 | 114,577 | 92,712 | 82,567 |
| 2000's | 93,589 | 94,803 | 73,666 | 56,273 | 59,668 | 80,358 | 87,001 | 91,166 | 147,955 | 101,586 |
| 2010's | 107,474 | 123,554 | 133,263 | 143,435 | 148,458 | 127,167 | 148,317 | 174,950 | 138,382 | 147,022 |
| 2020's | 143,813 |
| - = No Data Reported; -- = Not Applicable; NA = Not Available; W = Withheld to avoid disclosure of individual company data. |
| Release Date: 2/9/2022 |
| Next Release Date: Suspended |