|
Download Data (XLS File) |
|
|||||
|
|||||
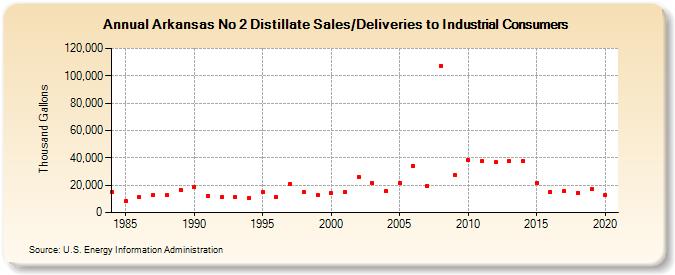
| Arkansas No 2 Distillate Sales/Deliveries to Industrial Consumers (Thousand Gallons) | |||||
| Decade | Year-0 | Year-1 | Year-2 | Year-3 | Year-4 | Year-5 | Year-6 | Year-7 | Year-8 | Year-9 |
|---|---|---|---|---|---|---|---|---|---|---|
| 1980's | 15,218 | 8,111 | 11,247 | 13,087 | 12,732 | 16,701 | ||||
| 1990's | 18,429 | 12,184 | 11,223 | 11,312 | 10,663 | 15,072 | 11,304 | 21,005 | 15,259 | 12,740 |
| 2000's | 14,447 | 15,226 | 26,100 | 21,564 | 15,724 | 21,454 | 34,072 | 19,583 | 107,268 | 27,438 |
| 2010's | 38,578 | 37,467 | 36,895 | 37,418 | 37,342 | 21,817 | 15,047 | 15,477 | 14,606 | 17,108 |
| 2020's | 12,609 |
| - = No Data Reported; -- = Not Applicable; NA = Not Available; W = Withheld to avoid disclosure of individual company data. |
| Release Date: 2/9/2022 |
| Next Release Date: Suspended |