|
Download Data (XLS File) |
|
|||||
|
|||||
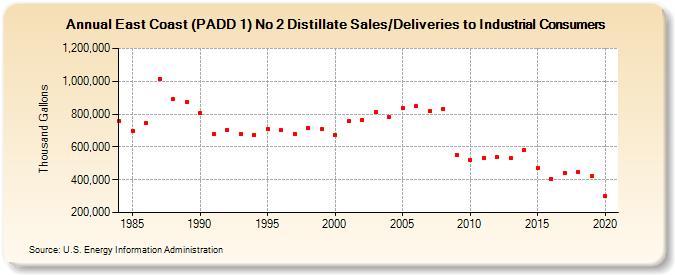
| East Coast (PADD 1) No 2 Distillate Sales/Deliveries to Industrial Consumers (Thousand Gallons) | |||||
| Decade | Year-0 | Year-1 | Year-2 | Year-3 | Year-4 | Year-5 | Year-6 | Year-7 | Year-8 | Year-9 |
|---|---|---|---|---|---|---|---|---|---|---|
| 1980's | 756,127 | 697,577 | 745,692 | 1,016,513 | 893,869 | 870,585 | ||||
| 1990's | 803,985 | 677,781 | 703,289 | 680,320 | 674,845 | 707,850 | 700,114 | 680,167 | 715,245 | 707,123 |
| 2000's | 674,155 | 757,271 | 766,634 | 810,276 | 780,251 | 836,768 | 848,687 | 818,428 | 830,977 | 551,229 |
| 2010's | 521,673 | 532,107 | 536,227 | 531,449 | 582,407 | 473,355 | 405,886 | 441,530 | 449,065 | 421,810 |
| 2020's | 298,296 |
| - = No Data Reported; -- = Not Applicable; NA = Not Available; W = Withheld to avoid disclosure of individual company data. |
| Release Date: 2/9/2022 |
| Next Release Date: Suspended |