|
Download Data (XLS File) |
|
|||||
|
|||||
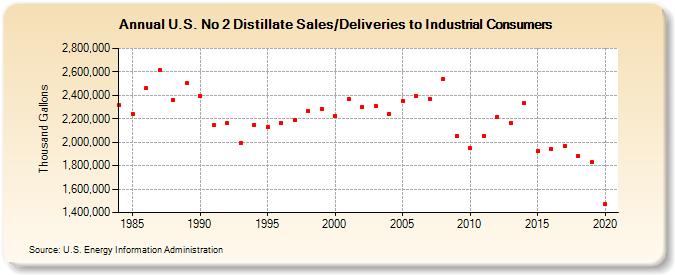
| U.S. No 2 Distillate Sales/Deliveries to Industrial Consumers (Thousand Gallons) | |||||
| Decade | Year-0 | Year-1 | Year-2 | Year-3 | Year-4 | Year-5 | Year-6 | Year-7 | Year-8 | Year-9 |
|---|---|---|---|---|---|---|---|---|---|---|
| 1980's | 2,314,884 | 2,240,970 | 2,459,626 | 2,611,955 | 2,357,993 | 2,502,644 | ||||
| 1990's | 2,397,876 | 2,143,590 | 2,161,259 | 1,990,521 | 2,148,160 | 2,130,944 | 2,166,263 | 2,186,507 | 2,261,945 | 2,283,847 |
| 2000's | 2,227,548 | 2,369,431 | 2,302,261 | 2,308,917 | 2,243,783 | 2,352,481 | 2,393,952 | 2,371,370 | 2,534,715 | 2,054,633 |
| 2010's | 1,948,268 | 2,055,831 | 2,215,033 | 2,166,852 | 2,331,449 | 1,924,900 | 1,939,825 | 1,963,764 | 1,884,310 | 1,828,790 |
| 2020's | 1,472,329 |
| - = No Data Reported; -- = Not Applicable; NA = Not Available; W = Withheld to avoid disclosure of individual company data. |
| Release Date: 2/9/2022 |
| Next Release Date: Suspended |