|
Download Data (XLS File) |
|
|||||
|
|||||
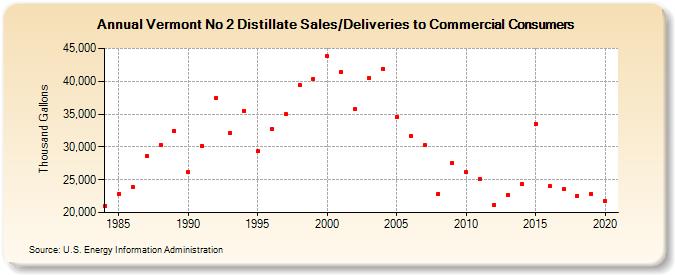
| Vermont No 2 Distillate Sales/Deliveries to Commercial Consumers (Thousand Gallons) | |||||
| Decade | Year-0 | Year-1 | Year-2 | Year-3 | Year-4 | Year-5 | Year-6 | Year-7 | Year-8 | Year-9 |
|---|---|---|---|---|---|---|---|---|---|---|
| 1980's | 21,032 | 22,897 | 23,941 | 28,591 | 30,360 | 32,431 | ||||
| 1990's | 26,135 | 30,169 | 37,513 | 32,124 | 35,532 | 29,304 | 32,746 | 34,963 | 39,429 | 40,341 |
| 2000's | 43,780 | 41,385 | 35,715 | 40,511 | 41,912 | 34,508 | 31,732 | 30,242 | 22,873 | 27,592 |
| 2010's | 26,124 | 25,067 | 21,184 | 22,726 | 24,412 | 33,560 | 24,000 | 23,546 | 22,529 | 22,852 |
| 2020's | 21,731 |
| - = No Data Reported; -- = Not Applicable; NA = Not Available; W = Withheld to avoid disclosure of individual company data. |
| Release Date: 2/9/2022 |
| Next Release Date: Suspended |