|
Download Data (XLS File) |
|
|||||
|
|||||
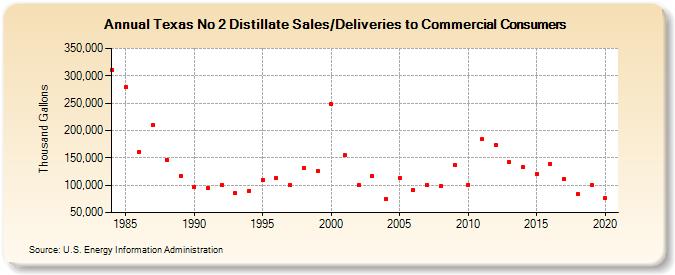
| Texas No 2 Distillate Sales/Deliveries to Commercial Consumers (Thousand Gallons) | |||||
| Decade | Year-0 | Year-1 | Year-2 | Year-3 | Year-4 | Year-5 | Year-6 | Year-7 | Year-8 | Year-9 |
|---|---|---|---|---|---|---|---|---|---|---|
| 1980's | 310,140 | 278,663 | 161,134 | 209,281 | 146,585 | 117,485 | ||||
| 1990's | 96,153 | 94,246 | 100,954 | 84,976 | 89,909 | 109,729 | 113,049 | 100,118 | 131,822 | 126,678 |
| 2000's | 248,038 | 154,273 | 100,010 | 117,133 | 75,273 | 114,023 | 91,655 | 100,706 | 97,965 | 136,408 |
| 2010's | 100,886 | 184,312 | 173,303 | 142,268 | 132,601 | 120,586 | 139,524 | 111,619 | 83,918 | 100,758 |
| 2020's | 75,765 |
| - = No Data Reported; -- = Not Applicable; NA = Not Available; W = Withheld to avoid disclosure of individual company data. |
| Release Date: 2/9/2022 |
| Next Release Date: Suspended |