|
Download Data (XLS File) |
|
|||||
|
|||||
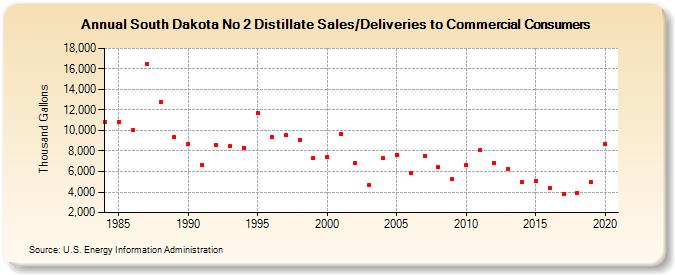
| South Dakota No 2 Distillate Sales/Deliveries to Commercial Consumers (Thousand Gallons) | |||||
| Decade | Year-0 | Year-1 | Year-2 | Year-3 | Year-4 | Year-5 | Year-6 | Year-7 | Year-8 | Year-9 |
|---|---|---|---|---|---|---|---|---|---|---|
| 1980's | 10,870 | 10,831 | 10,013 | 16,503 | 12,775 | 9,326 | ||||
| 1990's | 8,708 | 6,632 | 8,548 | 8,448 | 8,326 | 11,691 | 9,398 | 9,536 | 9,116 | 7,355 |
| 2000's | 7,419 | 9,690 | 6,847 | 4,685 | 7,326 | 7,633 | 5,810 | 7,527 | 6,403 | 5,253 |
| 2010's | 6,654 | 8,087 | 6,844 | 6,267 | 4,979 | 5,058 | 4,377 | 3,825 | 3,898 | 4,953 |
| 2020's | 8,715 |
| - = No Data Reported; -- = Not Applicable; NA = Not Available; W = Withheld to avoid disclosure of individual company data. |
| Release Date: 2/9/2022 |
| Next Release Date: Suspended |