|
Download Data (XLS File) |
|
|||||
|
|||||
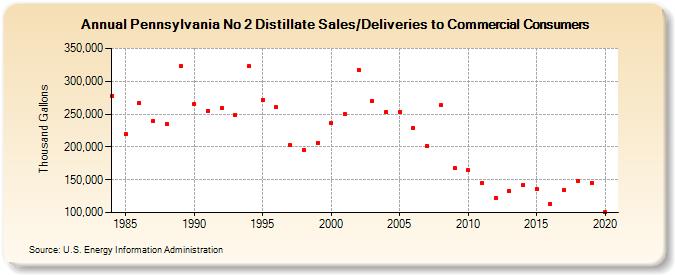
| Pennsylvania No 2 Distillate Sales/Deliveries to Commercial Consumers (Thousand Gallons) | |||||
| Decade | Year-0 | Year-1 | Year-2 | Year-3 | Year-4 | Year-5 | Year-6 | Year-7 | Year-8 | Year-9 |
|---|---|---|---|---|---|---|---|---|---|---|
| 1980's | 277,969 | 218,962 | 266,968 | 239,731 | 234,789 | 322,782 | ||||
| 1990's | 265,270 | 254,722 | 259,448 | 249,221 | 322,740 | 272,058 | 260,006 | 202,309 | 195,684 | 206,377 |
| 2000's | 235,889 | 249,425 | 317,520 | 270,178 | 253,328 | 252,815 | 229,205 | 201,506 | 263,285 | 167,669 |
| 2010's | 164,386 | 145,483 | 122,799 | 133,300 | 141,715 | 135,837 | 113,448 | 135,112 | 148,783 | 145,593 |
| 2020's | 101,366 |
| - = No Data Reported; -- = Not Applicable; NA = Not Available; W = Withheld to avoid disclosure of individual company data. |
| Release Date: 2/9/2022 |
| Next Release Date: Suspended |