|
Download Data (XLS File) |
|
|||||
|
|||||
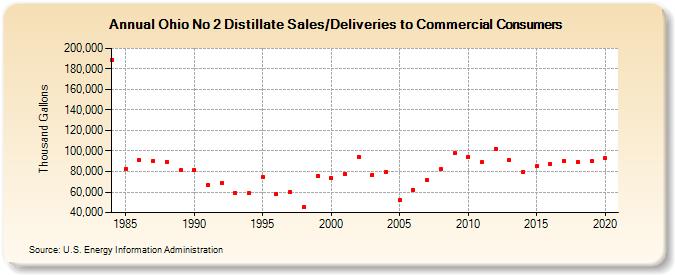
| Ohio No 2 Distillate Sales/Deliveries to Commercial Consumers (Thousand Gallons) | |||||
| Decade | Year-0 | Year-1 | Year-2 | Year-3 | Year-4 | Year-5 | Year-6 | Year-7 | Year-8 | Year-9 |
|---|---|---|---|---|---|---|---|---|---|---|
| 1980's | 189,002 | 82,714 | 91,211 | 90,562 | 89,582 | 81,222 | ||||
| 1990's | 81,601 | 66,862 | 69,159 | 59,490 | 58,991 | 74,688 | 57,652 | 60,075 | 45,135 | 75,732 |
| 2000's | 73,939 | 77,713 | 94,484 | 77,069 | 79,841 | 52,184 | 61,772 | 72,200 | 82,005 | 97,737 |
| 2010's | 94,606 | 88,801 | 102,298 | 91,440 | 79,377 | 84,927 | 87,489 | 90,582 | 89,733 | 89,944 |
| 2020's | 92,853 |
| - = No Data Reported; -- = Not Applicable; NA = Not Available; W = Withheld to avoid disclosure of individual company data. |
| Release Date: 2/9/2022 |
| Next Release Date: Suspended |