|
Download Data (XLS File) |
|
|||||
|
|||||
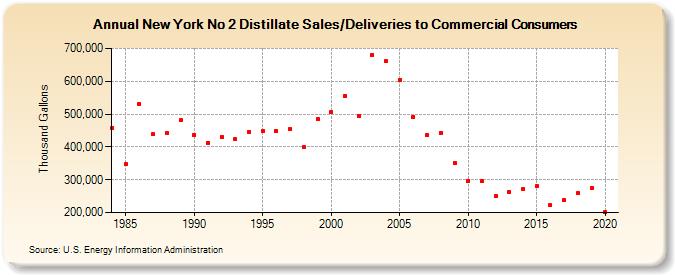
| New York No 2 Distillate Sales/Deliveries to Commercial Consumers (Thousand Gallons) | |||||
| Decade | Year-0 | Year-1 | Year-2 | Year-3 | Year-4 | Year-5 | Year-6 | Year-7 | Year-8 | Year-9 |
|---|---|---|---|---|---|---|---|---|---|---|
| 1980's | 456,981 | 346,937 | 530,972 | 437,789 | 442,284 | 481,609 | ||||
| 1990's | 436,594 | 412,829 | 431,154 | 423,060 | 445,400 | 447,295 | 448,581 | 454,933 | 398,507 | 485,162 |
| 2000's | 505,963 | 555,772 | 493,451 | 679,262 | 660,736 | 603,561 | 491,505 | 435,377 | 442,438 | 352,235 |
| 2010's | 297,033 | 295,990 | 249,845 | 262,895 | 270,767 | 280,835 | 221,674 | 237,325 | 258,434 | 274,204 |
| 2020's | 202,984 |
| - = No Data Reported; -- = Not Applicable; NA = Not Available; W = Withheld to avoid disclosure of individual company data. |
| Release Date: 2/9/2022 |
| Next Release Date: Suspended |