|
Download Data (XLS File) |
|
|||||
|
|||||
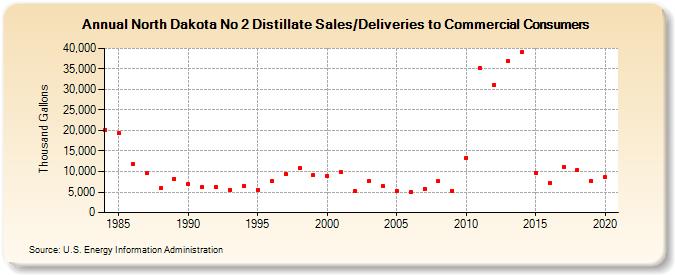
| North Dakota No 2 Distillate Sales/Deliveries to Commercial Consumers (Thousand Gallons) | |||||
| Decade | Year-0 | Year-1 | Year-2 | Year-3 | Year-4 | Year-5 | Year-6 | Year-7 | Year-8 | Year-9 |
|---|---|---|---|---|---|---|---|---|---|---|
| 1980's | 20,218 | 19,272 | 11,902 | 9,530 | 5,901 | 8,261 | ||||
| 1990's | 6,948 | 6,226 | 6,121 | 5,607 | 6,487 | 5,599 | 7,747 | 9,440 | 10,809 | 9,043 |
| 2000's | 8,950 | 9,782 | 5,174 | 7,592 | 6,417 | 5,298 | 4,922 | 5,777 | 7,624 | 5,366 |
| 2010's | 13,409 | 35,117 | 31,087 | 36,933 | 39,174 | 9,716 | 7,307 | 11,129 | 10,427 | 7,651 |
| 2020's | 8,623 |
| - = No Data Reported; -- = Not Applicable; NA = Not Available; W = Withheld to avoid disclosure of individual company data. |
| Release Date: 2/9/2022 |
| Next Release Date: Suspended |