|
Download Data (XLS File) |
|
|||||
|
|||||
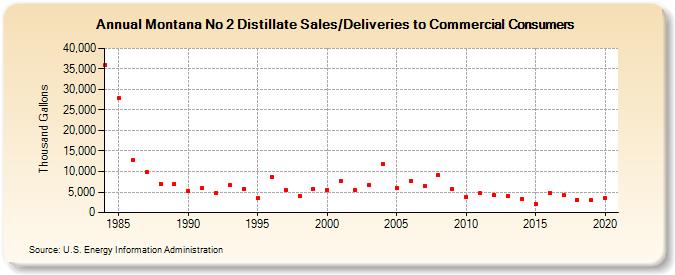
| Montana No 2 Distillate Sales/Deliveries to Commercial Consumers (Thousand Gallons) | |||||
| Decade | Year-0 | Year-1 | Year-2 | Year-3 | Year-4 | Year-5 | Year-6 | Year-7 | Year-8 | Year-9 |
|---|---|---|---|---|---|---|---|---|---|---|
| 1980's | 35,963 | 27,795 | 12,742 | 9,847 | 7,030 | 7,031 | ||||
| 1990's | 5,289 | 5,906 | 4,872 | 6,599 | 5,826 | 3,433 | 8,726 | 5,514 | 4,050 | 5,626 |
| 2000's | 5,601 | 7,735 | 5,384 | 6,740 | 11,784 | 6,088 | 7,755 | 6,524 | 9,049 | 5,631 |
| 2010's | 3,722 | 4,694 | 4,203 | 4,031 | 3,303 | 2,032 | 4,834 | 4,179 | 3,175 | 3,032 |
| 2020's | 3,470 |
| - = No Data Reported; -- = Not Applicable; NA = Not Available; W = Withheld to avoid disclosure of individual company data. |
| Release Date: 2/9/2022 |
| Next Release Date: Suspended |