|
Download Data (XLS File) |
|
|||||
|
|||||
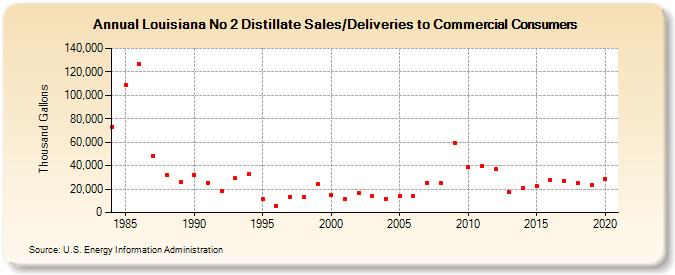
| Louisiana No 2 Distillate Sales/Deliveries to Commercial Consumers (Thousand Gallons) | |||||
| Decade | Year-0 | Year-1 | Year-2 | Year-3 | Year-4 | Year-5 | Year-6 | Year-7 | Year-8 | Year-9 |
|---|---|---|---|---|---|---|---|---|---|---|
| 1980's | 73,379 | 108,726 | 126,616 | 48,488 | 31,919 | 25,830 | ||||
| 1990's | 32,017 | 25,488 | 18,394 | 29,099 | 32,670 | 11,175 | 5,682 | 13,393 | 13,127 | 24,270 |
| 2000's | 14,719 | 11,771 | 16,257 | 14,486 | 11,429 | 13,888 | 14,108 | 25,227 | 25,025 | 59,689 |
| 2010's | 38,695 | 39,659 | 36,840 | 17,590 | 21,197 | 22,807 | 27,536 | 27,149 | 24,927 | 23,572 |
| 2020's | 28,746 |
| - = No Data Reported; -- = Not Applicable; NA = Not Available; W = Withheld to avoid disclosure of individual company data. |
| Release Date: 2/9/2022 |
| Next Release Date: Suspended |