|
Download Data (XLS File) |
|
|||||
|
|||||
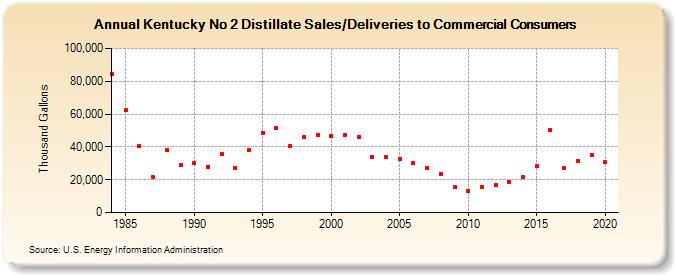
| Kentucky No 2 Distillate Sales/Deliveries to Commercial Consumers (Thousand Gallons) | |||||
| Decade | Year-0 | Year-1 | Year-2 | Year-3 | Year-4 | Year-5 | Year-6 | Year-7 | Year-8 | Year-9 |
|---|---|---|---|---|---|---|---|---|---|---|
| 1980's | 84,121 | 62,628 | 40,418 | 21,630 | 38,194 | 28,760 | ||||
| 1990's | 30,068 | 28,004 | 35,902 | 26,955 | 38,195 | 48,711 | 51,238 | 40,318 | 45,970 | 47,434 |
| 2000's | 46,568 | 47,166 | 46,037 | 34,143 | 33,641 | 32,381 | 30,319 | 27,247 | 23,645 | 15,548 |
| 2010's | 13,302 | 15,660 | 16,683 | 18,715 | 21,473 | 28,135 | 50,390 | 27,118 | 31,141 | 35,222 |
| 2020's | 30,583 |
| - = No Data Reported; -- = Not Applicable; NA = Not Available; W = Withheld to avoid disclosure of individual company data. |
| Release Date: 2/9/2022 |
| Next Release Date: Suspended |