|
Download Data (XLS File) |
|
|||||
|
|||||
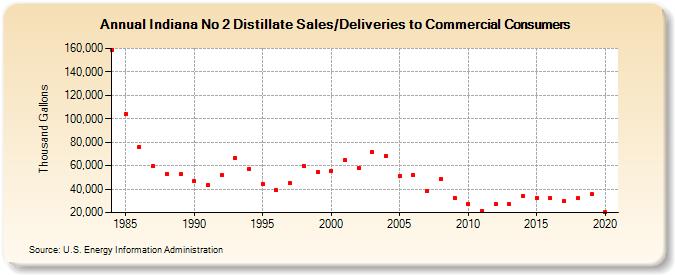
| Indiana No 2 Distillate Sales/Deliveries to Commercial Consumers (Thousand Gallons) | |||||
| Decade | Year-0 | Year-1 | Year-2 | Year-3 | Year-4 | Year-5 | Year-6 | Year-7 | Year-8 | Year-9 |
|---|---|---|---|---|---|---|---|---|---|---|
| 1980's | 158,945 | 104,035 | 76,144 | 59,306 | 53,212 | 52,506 | ||||
| 1990's | 46,674 | 43,893 | 52,072 | 66,592 | 57,098 | 44,536 | 39,090 | 44,819 | 59,805 | 54,378 |
| 2000's | 55,790 | 64,693 | 57,661 | 71,726 | 68,341 | 51,299 | 52,123 | 38,633 | 48,483 | 32,780 |
| 2010's | 27,376 | 21,621 | 27,195 | 26,915 | 33,947 | 32,514 | 32,404 | 30,043 | 32,014 | 35,747 |
| 2020's | 20,654 |
| - = No Data Reported; -- = Not Applicable; NA = Not Available; W = Withheld to avoid disclosure of individual company data. |
| Release Date: 2/9/2022 |
| Next Release Date: Suspended |