|
Download Data (XLS File) |
|
|||||
|
|||||
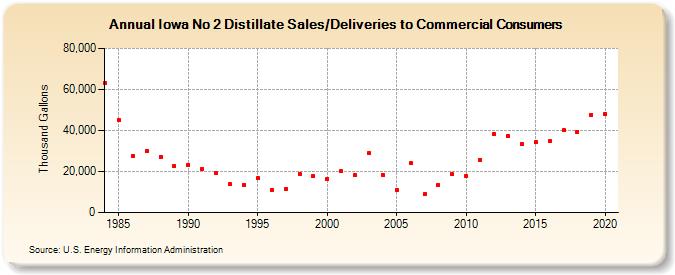
| Iowa No 2 Distillate Sales/Deliveries to Commercial Consumers (Thousand Gallons) | |||||
| Decade | Year-0 | Year-1 | Year-2 | Year-3 | Year-4 | Year-5 | Year-6 | Year-7 | Year-8 | Year-9 |
|---|---|---|---|---|---|---|---|---|---|---|
| 1980's | 63,056 | 45,065 | 27,697 | 30,034 | 27,313 | 22,672 | ||||
| 1990's | 23,403 | 21,364 | 19,218 | 13,789 | 13,659 | 16,767 | 11,235 | 11,537 | 18,930 | 17,730 |
| 2000's | 16,493 | 20,033 | 18,061 | 28,852 | 18,324 | 11,187 | 23,972 | 8,980 | 13,444 | 18,647 |
| 2010's | 17,791 | 25,746 | 38,180 | 37,322 | 33,590 | 34,253 | 34,727 | 40,170 | 39,411 | 47,716 |
| 2020's | 48,172 |
| - = No Data Reported; -- = Not Applicable; NA = Not Available; W = Withheld to avoid disclosure of individual company data. |
| Release Date: 2/9/2022 |
| Next Release Date: Suspended |