|
Download Data (XLS File) |
|
|||||
|
|||||
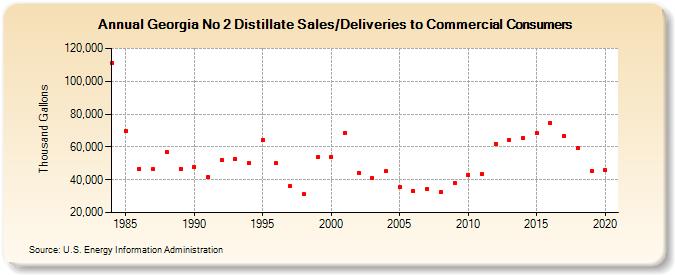
| Georgia No 2 Distillate Sales/Deliveries to Commercial Consumers (Thousand Gallons) | |||||
| Decade | Year-0 | Year-1 | Year-2 | Year-3 | Year-4 | Year-5 | Year-6 | Year-7 | Year-8 | Year-9 |
|---|---|---|---|---|---|---|---|---|---|---|
| 1980's | 111,170 | 69,782 | 46,689 | 46,333 | 56,878 | 46,722 | ||||
| 1990's | 47,644 | 41,402 | 52,197 | 52,547 | 50,438 | 64,055 | 49,979 | 36,150 | 31,279 | 53,696 |
| 2000's | 54,125 | 68,608 | 44,302 | 40,750 | 45,141 | 35,404 | 33,001 | 34,434 | 32,392 | 37,990 |
| 2010's | 43,066 | 43,548 | 61,884 | 64,369 | 65,426 | 68,183 | 74,773 | 66,727 | 59,150 | 45,463 |
| 2020's | 45,780 |
| - = No Data Reported; -- = Not Applicable; NA = Not Available; W = Withheld to avoid disclosure of individual company data. |
| Release Date: 2/9/2022 |
| Next Release Date: Suspended |