|
Download Data (XLS File) |
|
|||||
|
|||||
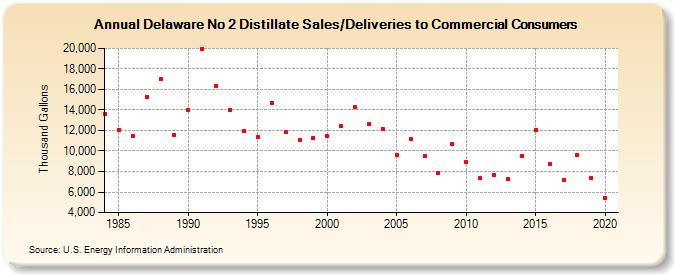
| Delaware No 2 Distillate Sales/Deliveries to Commercial Consumers (Thousand Gallons) | |||||
| Decade | Year-0 | Year-1 | Year-2 | Year-3 | Year-4 | Year-5 | Year-6 | Year-7 | Year-8 | Year-9 |
|---|---|---|---|---|---|---|---|---|---|---|
| 1980's | 13,621 | 12,081 | 11,459 | 15,293 | 17,003 | 11,583 | ||||
| 1990's | 13,989 | 19,944 | 16,370 | 14,037 | 11,944 | 11,370 | 14,717 | 11,805 | 11,041 | 11,265 |
| 2000's | 11,433 | 12,397 | 14,248 | 12,593 | 12,159 | 9,622 | 11,200 | 9,535 | 7,857 | 10,698 |
| 2010's | 8,912 | 7,341 | 7,664 | 7,298 | 9,552 | 12,006 | 8,704 | 7,147 | 9,581 | 7,354 |
| 2020's | 5,465 |
| - = No Data Reported; -- = Not Applicable; NA = Not Available; W = Withheld to avoid disclosure of individual company data. |
| Release Date: 2/9/2022 |
| Next Release Date: Suspended |