|
Download Data (XLS File) |
|
|||||
|
|||||
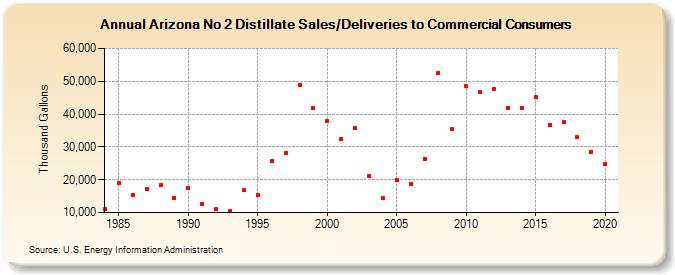
| Arizona No 2 Distillate Sales/Deliveries to Commercial Consumers (Thousand Gallons) | |||||
| Decade | Year-0 | Year-1 | Year-2 | Year-3 | Year-4 | Year-5 | Year-6 | Year-7 | Year-8 | Year-9 |
|---|---|---|---|---|---|---|---|---|---|---|
| 1980's | 10,988 | 18,957 | 15,309 | 17,192 | 18,276 | 14,421 | ||||
| 1990's | 17,340 | 12,604 | 10,966 | 10,588 | 16,764 | 15,419 | 25,576 | 28,253 | 48,941 | 41,744 |
| 2000's | 38,030 | 32,535 | 35,869 | 21,211 | 14,443 | 19,801 | 18,686 | 26,423 | 52,619 | 35,384 |
| 2010's | 48,523 | 46,712 | 47,626 | 41,912 | 41,951 | 45,158 | 36,751 | 37,493 | 32,869 | 28,452 |
| 2020's | 24,750 |
| - = No Data Reported; -- = Not Applicable; NA = Not Available; W = Withheld to avoid disclosure of individual company data. |
| Release Date: 2/9/2022 |
| Next Release Date: Suspended |