|
Download Data (XLS File) |
|
|||||
|
|||||
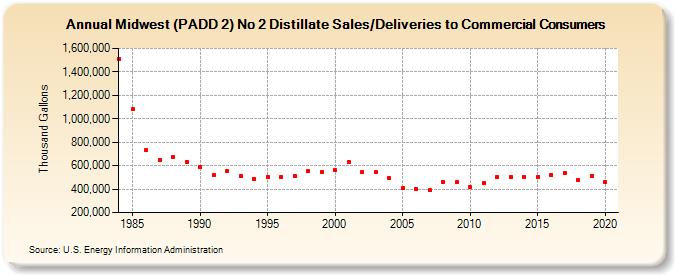
| Midwest (PADD 2) No 2 Distillate Sales/Deliveries to Commercial Consumers (Thousand Gallons) | |||||
| Decade | Year-0 | Year-1 | Year-2 | Year-3 | Year-4 | Year-5 | Year-6 | Year-7 | Year-8 | Year-9 |
|---|---|---|---|---|---|---|---|---|---|---|
| 1980's | 1,510,042 | 1,081,449 | 731,791 | 652,010 | 674,277 | 633,207 | ||||
| 1990's | 592,640 | 520,411 | 552,792 | 511,373 | 490,021 | 506,292 | 505,306 | 511,624 | 552,548 | 549,470 |
| 2000's | 563,177 | 633,620 | 544,835 | 542,886 | 491,890 | 408,025 | 397,884 | 390,618 | 458,312 | 457,957 |
| 2010's | 418,479 | 450,103 | 501,237 | 502,918 | 507,113 | 504,905 | 522,769 | 536,776 | 478,502 | 514,041 |
| 2020's | 456,944 |
| - = No Data Reported; -- = Not Applicable; NA = Not Available; W = Withheld to avoid disclosure of individual company data. |
| Release Date: 2/9/2022 |
| Next Release Date: Suspended |