|
Download Data (XLS File) |
|
|||||
|
|||||
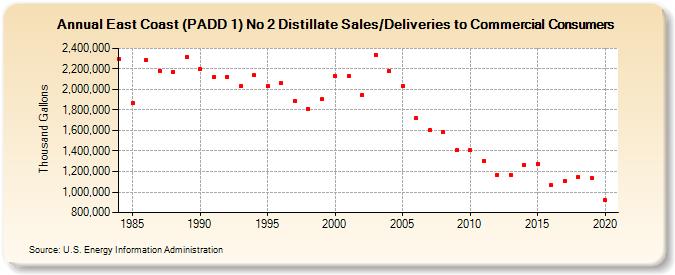
| East Coast (PADD 1) No 2 Distillate Sales/Deliveries to Commercial Consumers (Thousand Gallons) | |||||
| Decade | Year-0 | Year-1 | Year-2 | Year-3 | Year-4 | Year-5 | Year-6 | Year-7 | Year-8 | Year-9 |
|---|---|---|---|---|---|---|---|---|---|---|
| 1980's | 2,292,935 | 1,863,007 | 2,284,911 | 2,182,231 | 2,169,781 | 2,311,463 | ||||
| 1990's | 2,194,666 | 2,118,979 | 2,125,960 | 2,031,506 | 2,136,592 | 2,034,827 | 2,063,499 | 1,883,045 | 1,808,291 | 1,901,907 |
| 2000's | 2,127,408 | 2,130,543 | 1,946,851 | 2,339,110 | 2,183,566 | 2,031,562 | 1,717,786 | 1,601,375 | 1,585,240 | 1,406,032 |
| 2010's | 1,405,477 | 1,306,682 | 1,170,896 | 1,168,460 | 1,264,840 | 1,277,177 | 1,065,206 | 1,105,776 | 1,146,533 | 1,138,495 |
| 2020's | 920,976 |
| - = No Data Reported; -- = Not Applicable; NA = Not Available; W = Withheld to avoid disclosure of individual company data. |
| Release Date: 2/9/2022 |
| Next Release Date: Suspended |