|
Download Data (XLS File) |
|
|||||
|
|||||
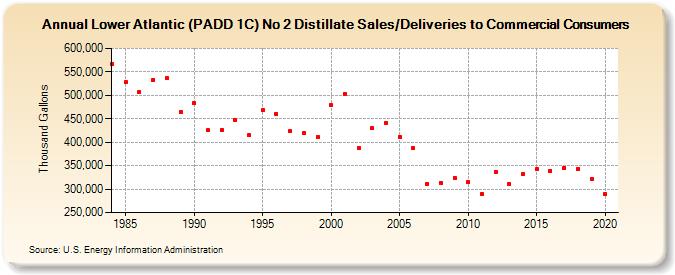
| Lower Atlantic (PADD 1C) No 2 Distillate Sales/Deliveries to Commercial Consumers (Thousand Gallons) | |||||
| Decade | Year-0 | Year-1 | Year-2 | Year-3 | Year-4 | Year-5 | Year-6 | Year-7 | Year-8 | Year-9 |
|---|---|---|---|---|---|---|---|---|---|---|
| 1980's | 565,760 | 527,731 | 506,557 | 533,396 | 536,804 | 465,095 | ||||
| 1990's | 482,919 | 425,257 | 427,041 | 446,820 | 414,396 | 468,774 | 459,691 | 423,055 | 419,304 | 411,855 |
| 2000's | 478,347 | 503,715 | 387,366 | 429,558 | 441,514 | 412,110 | 386,863 | 311,789 | 313,671 | 324,169 |
| 2010's | 315,577 | 290,378 | 337,248 | 311,649 | 331,457 | 342,592 | 339,615 | 345,489 | 342,881 | 321,336 |
| 2020's | 289,119 |
| - = No Data Reported; -- = Not Applicable; NA = Not Available; W = Withheld to avoid disclosure of individual company data. |
| Release Date: 2/9/2022 |
| Next Release Date: Suspended |