|
Download Data (XLS File) |
|
|||||
|
|||||
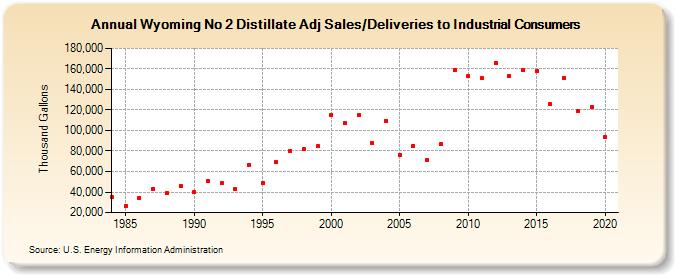
| Wyoming No 2 Distillate Adj Sales/Deliveries to Industrial Consumers (Thousand Gallons) | |||||
| Decade | Year-0 | Year-1 | Year-2 | Year-3 | Year-4 | Year-5 | Year-6 | Year-7 | Year-8 | Year-9 |
|---|---|---|---|---|---|---|---|---|---|---|
| 1980's | 35,649 | 26,575 | 34,471 | 43,019 | 38,969 | 46,307 | ||||
| 1990's | 40,267 | 50,666 | 48,517 | 42,489 | 66,065 | 48,821 | 68,812 | 79,765 | 81,640 | 84,603 |
| 2000's | 114,707 | 107,241 | 114,936 | 87,459 | 109,673 | 75,930 | 84,870 | 71,393 | 86,486 | 158,647 |
| 2010's | 152,694 | 150,749 | 166,065 | 153,559 | 159,172 | 158,078 | 125,698 | 151,047 | 118,999 | 122,737 |
| 2020's | 93,450 |
| - = No Data Reported; -- = Not Applicable; NA = Not Available; W = Withheld to avoid disclosure of individual company data. |
| Release Date: 2/9/2022 |
| Next Release Date: Suspended |