|
Download Data (XLS File) |
|
|||||
|
|||||
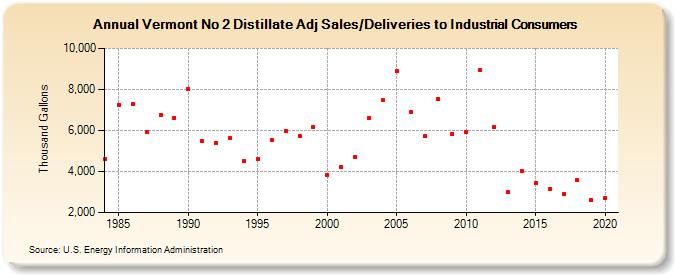
| Vermont No 2 Distillate Adj Sales/Deliveries to Industrial Consumers (Thousand Gallons) | |||||
| Decade | Year-0 | Year-1 | Year-2 | Year-3 | Year-4 | Year-5 | Year-6 | Year-7 | Year-8 | Year-9 |
|---|---|---|---|---|---|---|---|---|---|---|
| 1980's | 4,628 | 7,256 | 7,283 | 5,948 | 6,730 | 6,626 | ||||
| 1990's | 8,023 | 5,491 | 5,379 | 5,636 | 4,505 | 4,602 | 5,519 | 5,974 | 5,748 | 6,164 |
| 2000's | 3,821 | 4,217 | 4,704 | 6,608 | 7,482 | 8,887 | 6,917 | 5,713 | 7,545 | 5,826 |
| 2010's | 5,930 | 8,938 | 6,188 | 2,998 | 4,036 | 3,437 | 3,160 | 2,888 | 3,570 | 2,599 |
| 2020's | 2,713 |
| - = No Data Reported; -- = Not Applicable; NA = Not Available; W = Withheld to avoid disclosure of individual company data. |
| Release Date: 2/9/2022 |
| Next Release Date: Suspended |