|
Download Data (XLS File) |
|
|||||
|
|||||
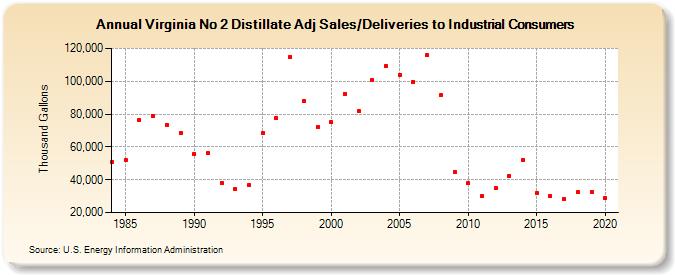
| Virginia No 2 Distillate Adj Sales/Deliveries to Industrial Consumers (Thousand Gallons) | |||||
| Decade | Year-0 | Year-1 | Year-2 | Year-3 | Year-4 | Year-5 | Year-6 | Year-7 | Year-8 | Year-9 |
|---|---|---|---|---|---|---|---|---|---|---|
| 1980's | 50,939 | 51,868 | 76,397 | 79,065 | 73,532 | 68,485 | ||||
| 1990's | 55,699 | 56,158 | 38,037 | 34,348 | 36,778 | 68,165 | 77,737 | 114,928 | 87,765 | 72,416 |
| 2000's | 75,075 | 92,374 | 81,646 | 100,732 | 109,453 | 103,944 | 99,593 | 115,741 | 91,428 | 44,742 |
| 2010's | 37,841 | 30,020 | 34,878 | 42,474 | 52,109 | 31,947 | 29,992 | 28,340 | 32,444 | 32,538 |
| 2020's | 28,979 |
| - = No Data Reported; -- = Not Applicable; NA = Not Available; W = Withheld to avoid disclosure of individual company data. |
| Release Date: 2/9/2022 |
| Next Release Date: Suspended |