|
Download Data (XLS File) |
|
|||||
|
|||||
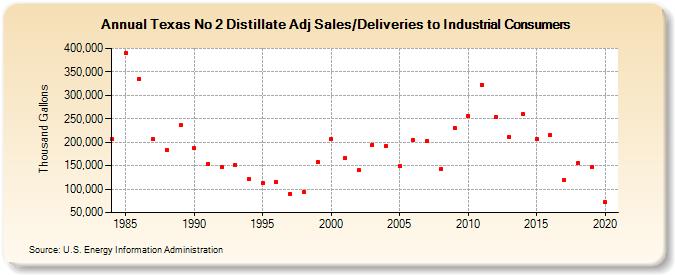
| Texas No 2 Distillate Adj Sales/Deliveries to Industrial Consumers (Thousand Gallons) | |||||
| Decade | Year-0 | Year-1 | Year-2 | Year-3 | Year-4 | Year-5 | Year-6 | Year-7 | Year-8 | Year-9 |
|---|---|---|---|---|---|---|---|---|---|---|
| 1980's | 205,765 | 389,929 | 335,057 | 206,542 | 183,910 | 236,002 | ||||
| 1990's | 186,813 | 154,243 | 147,645 | 152,446 | 122,311 | 112,568 | 114,795 | 90,634 | 93,875 | 157,739 |
| 2000's | 206,783 | 166,328 | 139,741 | 194,629 | 191,910 | 148,885 | 204,419 | 202,490 | 142,451 | 230,880 |
| 2010's | 256,049 | 322,560 | 252,872 | 211,303 | 259,260 | 206,326 | 214,991 | 118,863 | 155,548 | 146,474 |
| 2020's | 71,858 |
| - = No Data Reported; -- = Not Applicable; NA = Not Available; W = Withheld to avoid disclosure of individual company data. |
| Release Date: 2/9/2022 |
| Next Release Date: Suspended |