|
Download Data (XLS File) |
|
|||||
|
|||||
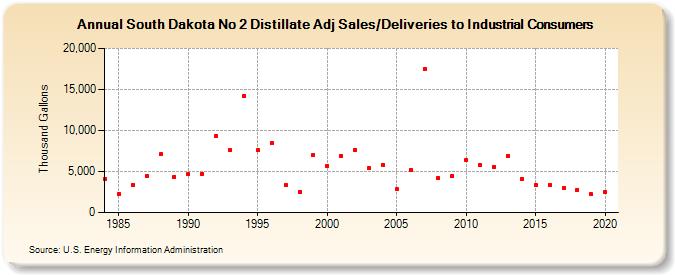
| South Dakota No 2 Distillate Adj Sales/Deliveries to Industrial Consumers (Thousand Gallons) | |||||
| Decade | Year-0 | Year-1 | Year-2 | Year-3 | Year-4 | Year-5 | Year-6 | Year-7 | Year-8 | Year-9 |
|---|---|---|---|---|---|---|---|---|---|---|
| 1980's | 4,116 | 2,269 | 3,410 | 4,444 | 7,081 | 4,390 | ||||
| 1990's | 4,682 | 4,756 | 9,350 | 7,627 | 14,247 | 7,566 | 8,417 | 3,385 | 2,557 | 7,013 |
| 2000's | 5,681 | 6,940 | 7,634 | 5,421 | 5,848 | 2,824 | 5,239 | 17,477 | 4,196 | 4,468 |
| 2010's | 6,390 | 5,811 | 5,559 | 6,947 | 4,119 | 3,313 | 3,413 | 2,958 | 2,757 | 2,201 |
| 2020's | 2,496 |
| - = No Data Reported; -- = Not Applicable; NA = Not Available; W = Withheld to avoid disclosure of individual company data. |
| Release Date: 2/9/2022 |
| Next Release Date: Suspended |