|
Download Data (XLS File) |
|
|||||
|
|||||
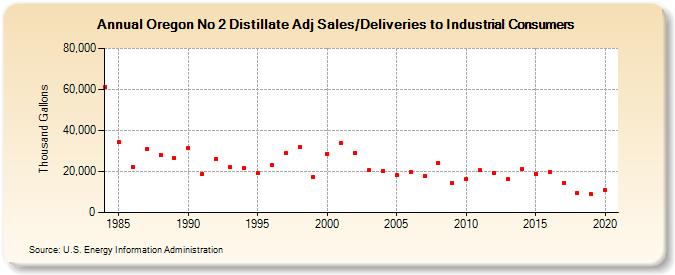
| Oregon No 2 Distillate Adj Sales/Deliveries to Industrial Consumers (Thousand Gallons) | |||||
| Decade | Year-0 | Year-1 | Year-2 | Year-3 | Year-4 | Year-5 | Year-6 | Year-7 | Year-8 | Year-9 |
|---|---|---|---|---|---|---|---|---|---|---|
| 1980's | 61,331 | 34,339 | 22,382 | 31,089 | 28,144 | 26,621 | ||||
| 1990's | 31,476 | 18,801 | 26,212 | 21,958 | 21,592 | 19,266 | 22,972 | 28,843 | 32,140 | 17,473 |
| 2000's | 28,718 | 33,709 | 29,259 | 20,541 | 20,304 | 18,082 | 19,812 | 17,915 | 24,300 | 14,365 |
| 2010's | 16,308 | 20,573 | 19,383 | 16,234 | 21,192 | 19,029 | 19,961 | 14,552 | 9,627 | 8,807 |
| 2020's | 11,019 |
| - = No Data Reported; -- = Not Applicable; NA = Not Available; W = Withheld to avoid disclosure of individual company data. |
| Release Date: 2/9/2022 |
| Next Release Date: Suspended |