|
Download Data (XLS File) |
|
|||||
|
|||||
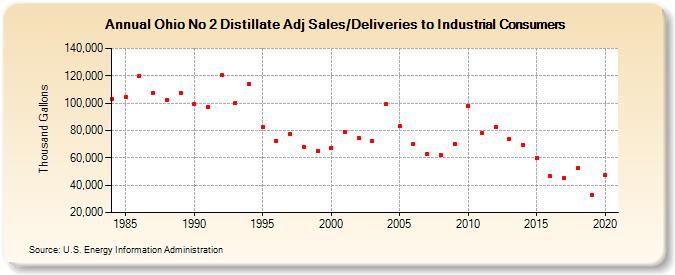
| Ohio No 2 Distillate Adj Sales/Deliveries to Industrial Consumers (Thousand Gallons) | |||||
| Decade | Year-0 | Year-1 | Year-2 | Year-3 | Year-4 | Year-5 | Year-6 | Year-7 | Year-8 | Year-9 |
|---|---|---|---|---|---|---|---|---|---|---|
| 1980's | 103,093 | 104,332 | 120,043 | 107,488 | 102,365 | 107,551 | ||||
| 1990's | 99,249 | 96,866 | 120,543 | 100,189 | 113,903 | 82,661 | 72,532 | 77,502 | 67,928 | 65,192 |
| 2000's | 67,477 | 79,027 | 74,344 | 72,262 | 99,079 | 82,913 | 70,083 | 63,126 | 62,218 | 70,173 |
| 2010's | 98,133 | 78,487 | 82,786 | 73,935 | 69,705 | 59,902 | 46,515 | 45,447 | 52,604 | 32,805 |
| 2020's | 47,223 |
| - = No Data Reported; -- = Not Applicable; NA = Not Available; W = Withheld to avoid disclosure of individual company data. |
| Release Date: 2/9/2022 |
| Next Release Date: Suspended |