|
Download Data (XLS File) |
|
|||||
|
|||||
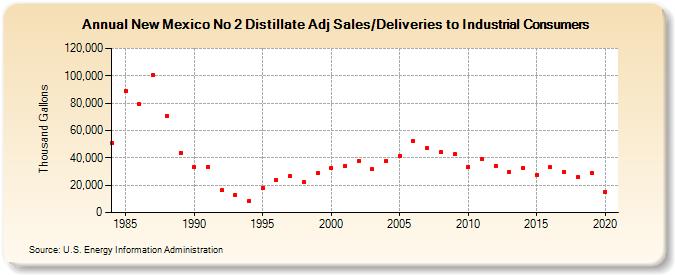
| New Mexico No 2 Distillate Adj Sales/Deliveries to Industrial Consumers (Thousand Gallons) | |||||
| Decade | Year-0 | Year-1 | Year-2 | Year-3 | Year-4 | Year-5 | Year-6 | Year-7 | Year-8 | Year-9 |
|---|---|---|---|---|---|---|---|---|---|---|
| 1980's | 50,713 | 88,783 | 79,035 | 100,699 | 70,634 | 43,764 | ||||
| 1990's | 32,955 | 33,470 | 16,385 | 13,132 | 8,573 | 17,829 | 23,857 | 26,474 | 22,023 | 28,861 |
| 2000's | 32,696 | 34,176 | 38,010 | 31,511 | 37,540 | 41,655 | 52,214 | 46,867 | 44,045 | 42,533 |
| 2010's | 33,664 | 39,213 | 34,394 | 29,834 | 32,487 | 27,690 | 33,045 | 29,782 | 25,797 | 29,100 |
| 2020's | 15,233 |
| - = No Data Reported; -- = Not Applicable; NA = Not Available; W = Withheld to avoid disclosure of individual company data. |
| Release Date: 2/9/2022 |
| Next Release Date: Suspended |