|
Download Data (XLS File) |
|
|||||
|
|||||
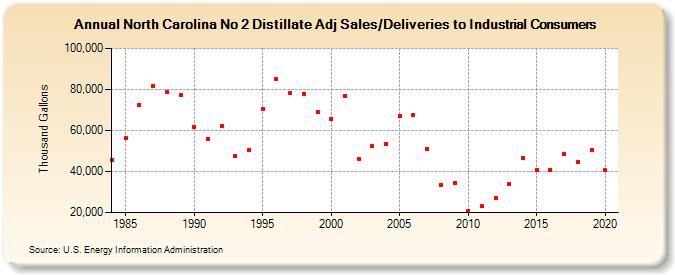
| North Carolina No 2 Distillate Adj Sales/Deliveries to Industrial Consumers (Thousand Gallons) | |||||
| Decade | Year-0 | Year-1 | Year-2 | Year-3 | Year-4 | Year-5 | Year-6 | Year-7 | Year-8 | Year-9 |
|---|---|---|---|---|---|---|---|---|---|---|
| 1980's | 45,754 | 56,154 | 72,600 | 81,728 | 78,801 | 77,258 | ||||
| 1990's | 61,678 | 55,924 | 62,266 | 47,742 | 50,530 | 70,425 | 85,106 | 78,284 | 77,814 | 68,921 |
| 2000's | 65,661 | 76,981 | 46,225 | 52,223 | 53,618 | 67,185 | 67,663 | 51,211 | 33,615 | 34,316 |
| 2010's | 20,917 | 23,175 | 26,950 | 34,004 | 46,466 | 40,860 | 40,955 | 48,479 | 44,507 | 50,264 |
| 2020's | 40,574 |
| - = No Data Reported; -- = Not Applicable; NA = Not Available; W = Withheld to avoid disclosure of individual company data. |
| Release Date: 2/9/2022 |
| Next Release Date: Suspended |