|
Download Data (XLS File) |
|
|||||
|
|||||
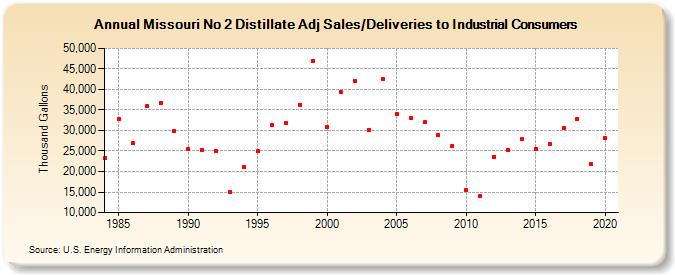
| Missouri No 2 Distillate Adj Sales/Deliveries to Industrial Consumers (Thousand Gallons) | |||||
| Decade | Year-0 | Year-1 | Year-2 | Year-3 | Year-4 | Year-5 | Year-6 | Year-7 | Year-8 | Year-9 |
|---|---|---|---|---|---|---|---|---|---|---|
| 1980's | 23,251 | 32,832 | 26,837 | 35,857 | 36,746 | 29,927 | ||||
| 1990's | 25,472 | 25,268 | 24,985 | 15,103 | 21,057 | 25,040 | 31,239 | 31,747 | 36,293 | 46,971 |
| 2000's | 30,959 | 39,364 | 42,099 | 30,221 | 42,557 | 34,106 | 32,971 | 31,973 | 28,778 | 26,294 |
| 2010's | 15,468 | 14,024 | 23,602 | 25,211 | 27,885 | 25,606 | 26,815 | 30,564 | 32,724 | 21,718 |
| 2020's | 28,215 |
| - = No Data Reported; -- = Not Applicable; NA = Not Available; W = Withheld to avoid disclosure of individual company data. |
| Release Date: 2/9/2022 |
| Next Release Date: Suspended |